Area (m²):1063 1.1946E-5
Illuminance (lux):1065 5.3638E2
Luminance (candela per m²):1067 5.3638E2
Luminous Flux (lumen):1064 6.4076E-3
Luminous intensity (candela):1066 6.4076E-3
Observer:1061 Photopic
Solid Angle (steradians):1062 1.0
Source:1060 FLMT09760
Device Source:1045 FLMT09760
Integration Begin:1046 270.00
Integration End:1047 800.00
Method:1048 Uses Simpson's Rule for integration.
Moles of Photons:1057 9.3680E-11
PAR uMoles/m²/sec:1059 9.1025E0
PAR uMoles:1058 6.7296E-5
Photons/cm²/sec:1055 7.6308E14
Total Photons:1056 5.6416E13
dBm:1053 -1.4072E1
eV:1054 1.5125E14
uJoule/cm²:1051 2.0286E2
uJoule:1049 2.4234E1
uWatt/cm²:1052 3.2778E2
uWatt:1050 3.9157E1
CCT:1086 8454K
CRI DC:1084 1.05E-2
CRI R01:1069 78.8 (8454K)
CRI R02:1070 75.9 (8454K)
CRI R03:1071 69.3 (8454K)
CRI R04:1072 78.7 (8454K)
CRI R05:1073 78.4 (8454K)
CRI R06:1074 69.7 (8454K)
CRI R07:1075 81.4 (8454K)
CRI R08:1076 75.3 (8454K)
CRI R09:1077 6.0 (8454K)
CRI R10:1078 38.2 (8454K)
CRI R11:1079 78.7 (8454K)
CRI R12:1080 48.3 (8454K)
CRI R13:1081 74.7 (8454K)
CRI R14:1082 81.7 (8454K)
CRI R15:1083 77.1 (8454K)
CRI Ra:1068 75.9 (8454K)
DC<5.4E-3:1085 false
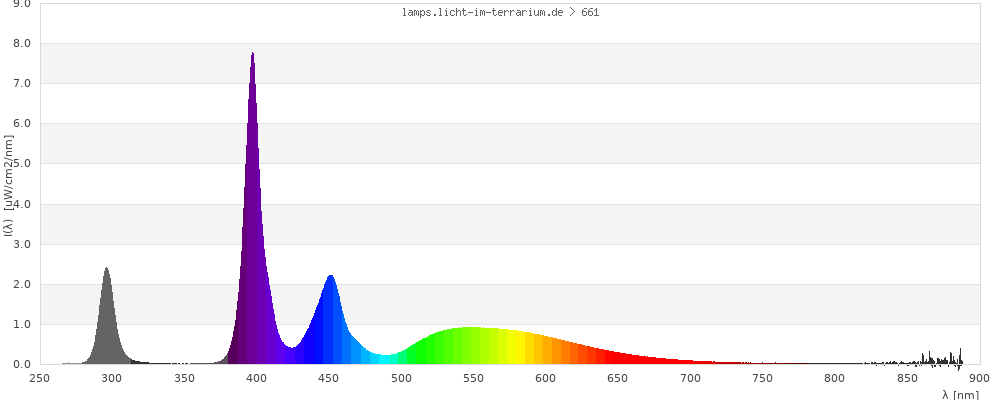
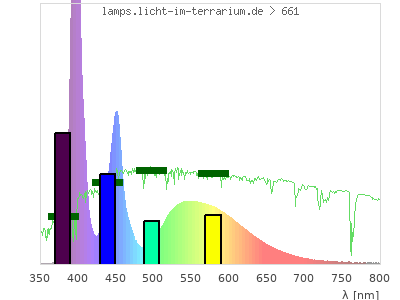
Colorimetry is the science to describe physically the human color perception. The wavelength range 380 nm - 780 nm is visible to humans and detected by three different photoreceptors. Many Reptiles see the range 350 nm - 800 nm and have an additional UV photoreceptor in their retina.
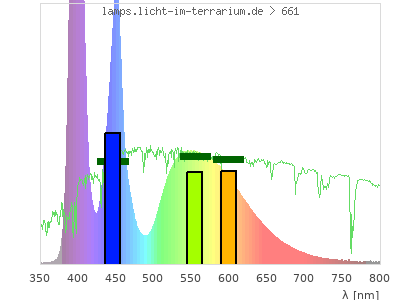
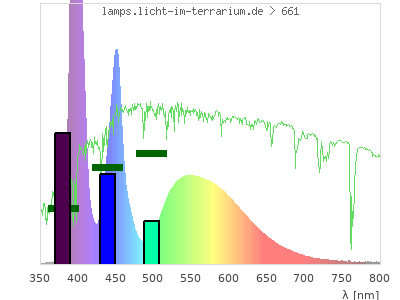
Whereas a spectrometer measures the intensity in every tiny wavelength interval resulting in thousands of individual intensities, the human eye only measures three intensities detected by the three cones. The same is true for the reptile eye with usually three or four photoreceptors. Effectively the detailled spectrum displayed above reduces to a much compacter bar graph displayed below. The photoreceptor sensitivites from these L-Cone, M-Cone, S-Cone, and U-Cone are used, they are chosen as an average of measured reptile photoreceptor sensitivity curves. The bar graph also shows as reference the intensity seen by the three or four photoreceptors for average sunlight (id 1).
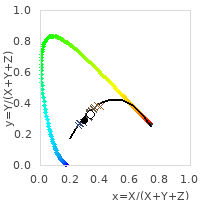
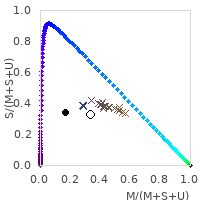
From these three numbers the colour coordinate and the correlated colour temperature for humans are calculated using the CIE standard method. I adapted this concept to a "3 cone reptile (M,S,U)" and a "4 cone reptile (L,M,S,U)". I am sure, that this adaption to other colour spaces makes sense mathematically and this is also done in scientific research regarding colour vision of animals, however I have not seen calculation of colour temperatures for other animals in the scientific literature. Even if it is hypothetical, at least this shows, how arbitrary the colour temperature is, and that the colour temperature calculated for humans does not apply to reptiles. The colour spaces also show the colour coordinates of different phases of daylight ((ids
1,
338 –
451,
511 –
513 ), indicated by crosses, coloured in the appriximate colour perceived by a human.
|
Human (CIE) |
3 cone reptile |
4 cone reptile |
| Cone Excitation |
| 
|  |
| Colour Coordinate |
( 0.3 ; 0.29 ) |
( 0.16 ; 0.34 ) |
( 0.16 ; 0.14
; 0.29 ) |
| CCT |
8400 Kelvin |
0 Kelvin |
24000 Kelvin |
| distance |
|
0 |
0.065 |
| colour space |
 |
 |
3-D-graph not implemented yet |
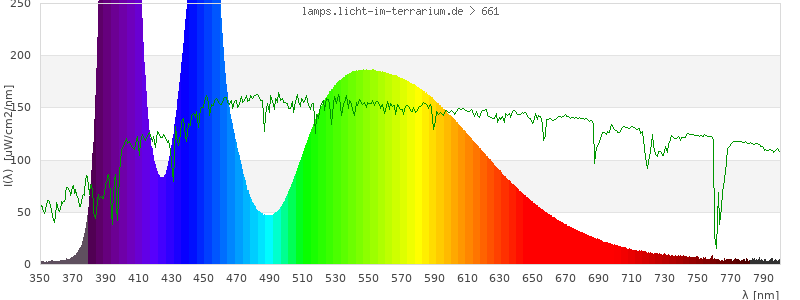
Vitamin D3 is produced by UVB radiation around 300 nm. 7DHC/ProD3 present in the skin is converted to PreD3 when absorbing an UV photon. PreD3 can be converted back to ProD3, to Lumisterol, or to Tachysterol when absorbing another UV photon or can be converted to Vitamin D3 in a warm environment.

This process prevents any overdose of vitamin D3 from UV radiation with a spectrum similar to sunlight. As a comparison the solar spectra at 20°(id:14) and at 85°(id:21) solar angle are shown.
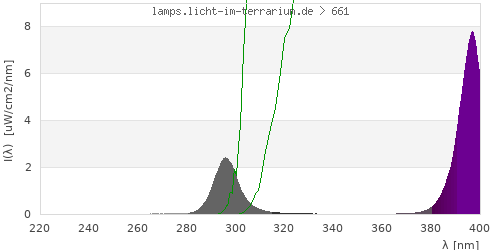
The ratio of the two solarmeters 6.2 (UVB) and 6.5 (UV index) readings has proven a useful and very simply number to acess the spectral shape in the vitamin-d3-active region.
Effective irradiances are calculated for all ranges, actionspectra and radiometers currently present in this database.
The calculation method is a numerical implementation (Simpson's rule) of the formula

To learn more about calculating effective irradiances and radiometers I recommend this excellent report on UVB meters: Characterizing the Performance of Integral Measuring UV-Meters (pdf).
The numbers in the following tables can also be used to estimate certain (effective) irradiances from radiomer readings. Example: If the database lists
- range: UVB (US) = 13.8 µW/cm²
- radiometer: Solarmeter 6.2 = 19.6 µW/cm²
then any Solarmeter 6.2 reading multiplied with 0.7 (0.7=13.8/19.6) is an estimate of UVB irradiance for this specific lamp. If you do so, always make sure, that the calculated (effective) irradiance is valid. The calculated value is not valid, if the lamp's spectrum is not measured in the relevant range.