Spectrum #472 BZ19 (Zoo Med ReptiSun 10.0 T8 18W) Edit
Delete(1) Raw Measurement
| Lampid | BZ19 |
|---|---|
| Spectrometer | USB2000+ (2) |
| Originator | Frances Baines |
| Ballast | - no ballast or default/unknown ballast - |
| Reflector | - no reflector - |
| Distance | 10 |
| Age | 105 |
created by Frances Baines, 12.02.2012; last updated by Frances Baines, 12.02.2012
Description
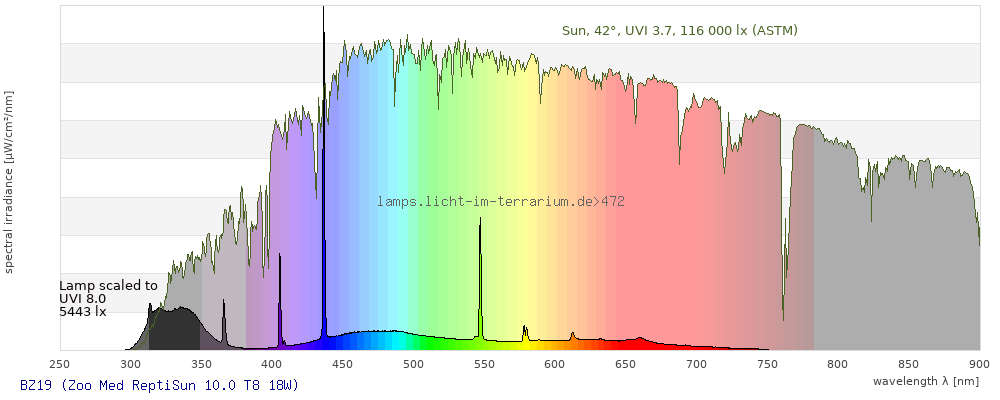
(2) Comparison of full spectrum to sunlight
The spectrum is compared to the ASTM spectrum. The measured spectrum is scaled to a lux or UVI value that seems to "make sense" to the database. This can go wrong, depending on the quality and range of the data.
(3) Colorimetry
Colorimetry is the science to describe physically the human color perception. The wavelength range 380 nm - 780 nm is visible to humans and detected by three different photoreceptors. Many Reptiles see the range 350 nm - 800 nm and have an additional UV photoreceptor in their retina.
Whereas a spectrometer measures the intensity in every tiny wavelength interval resulting in thousands of individual intensities, the human eye only measures three intensities detected by the three cones. The same is true for the reptile eye with usually three or four photoreceptors. Effectively the detailled spectrum displayed above reduces to a much compacter bar graph displayed below. The photoreceptor sensitivites from these L-Cone, M-Cone, S-Cone, and U-Cone are used, they are chosen as an average of measured reptile photoreceptor sensitivity curves. The bar graph also shows as reference the intensity seen by the three or four photoreceptors for average sunlight (ASTM spectrum).
From these three numbers the colour coordinate and the correlated colour temperature for humans are calculated using the CIE standard method. I adapted this concept to a "3 cone reptile (M,S,U)" and a "4 cone reptile (L,M,S,U)". I am sure, that this adaption to other colour spaces makes sense mathematically and this is also done in scientific research regarding colour vision of animals, however I have not seen calculation of colour temperatures for other animals in the scientific literature. Even if it is hypothetical, at least this shows, how arbitrary the colour temperature is, and that the colour temperature calculated for humans does not apply to reptiles. The colour spaces also show the colour coordinates of different phases of daylight ((ids 1, 338 – 451, 511 – 513 ), indicated by crosses, coloured in the appriximate colour perceived by a human.
| Human (CIE) | 3 cone reptile | 4 cone reptile | |
|---|---|---|---|
| Cone Excitation | |||
| Colour Coordinate | ( 0.27 ; 0.27 ) | ( 0.37 ; 0.48 ) | ( 0.21 ; 0.29 ; 0.37 ) |
| CCT | 12000 Kelvin | 5600 Kelvin | 6500 Kelvin |
| distance | 0.13 | 0.11 | |
| colour space | 3-D-graph not implemented yet |
(4) Vitamin D3 Analysis
Vitamin D3 is produced by UVB radiation around 300 nm. 7DHC/ProD3 present in the skin is converted to PreD3 when absorbing an UV photon. PreD3 can be converted back to ProD3, to Lumisterol, or to Tachysterol when absorbing another UV photon or can be converted to Vitamin D3 in a warm environment.

This process prevents any overdose of vitamin D3 from UV radiation with a spectrum similar to sunlight. As a comparison the solar spectra at 20°(id:14) and at 85°(id:21) solar angle are shown.
The ratio of the readings of two solarmeters 6.2 (UVB) and 6.5 (UV index) has proven a useful and very simply number to acess the spectral shape in the vitamin-d3-active region.
(5) Effective Irradiances
Effective irradiances are calculated for all ranges, actionspectra and radiometers currently present in this database.
The calculation method is a numerical implementation (Simpson's rule) of the formula
To learn more about calculating effective irradiances and radiometers I recommend this excellent report on UVB meters: Characterizing the Performance of Integral Measuring UV-Meters (pdf).
The numbers in the following tables can also be used to estimate certain (effective) irradiances from radiomer readings. Example: If the database lists
- range: UVB (US) = 13.8 µW/cm²
- radiometer: Solarmeter 6.2 = 19.6 µW/cm²
(5a) Ranges
total ( 0 nm - 0 nm) 715 µW/cm² = 7.15 W/m² UVC ( 0 nm - 280 nm) 0 µW/cm² = 0 W/m² non-terrestrial ( 0 nm - 290 nm) 0 µW/cm² = 0 W/m² total2 ( 250 nm - 880 nm) 715 µW/cm² = 7.15 W/m² UVB (EU) ( 280 nm - 315 nm) 34.4 µW/cm² = 0.344 W/m² UVB (US) ( 280 nm - 320 nm) 56.1 µW/cm² = 0.561 W/m² UVA+B ( 280 nm - 380 nm) 226 µW/cm² = 2.26 W/m² Solar UVB ( 290 nm - 315 nm) 34.4 µW/cm² = 0.344 W/m² UVA D3 regulating ( 315 nm - 335 nm) 89.9 µW/cm² = 0.899 W/m² UVA (EU) ( 315 nm - 380 nm) 191 µW/cm² = 1.91 W/m² UVA2 (medical definition) ( 320 nm - 340 nm) 92.5 µW/cm² = 0.925 W/m² UVA (US) ( 320 nm - 380 nm) 170 µW/cm² = 1.7 W/m² UVA1 (variant) ( 335 nm - 380 nm) 102 µW/cm² = 1.02 W/m² UVA1 (medical) ( 340 nm - 400 nm) 82.3 µW/cm² = 0.823 W/m² vis. UVA ( 350 nm - 380 nm) 39.4 µW/cm² = 0.394 W/m² VIS Rep3 ( 350 nm - 600 nm) 412 µW/cm² = 4.12 W/m² VIS Rep4 ( 350 nm - 700 nm) 515 µW/cm² = 5.15 W/m² purple ( 380 nm - 420 nm) 31.2 µW/cm² = 0.312 W/m² VIS ( 380 nm - 780 nm) 489 µW/cm² = 4.89 W/m² VIS2 ( 400 nm - 680 nm) 459 µW/cm² = 4.59 W/m² PAR ( 400 nm - 700 nm) 470 µW/cm² = 4.7 W/m² tmp ( 400 nm - 1100 nm) 484 µW/cm² = 4.84 W/m² blue ( 420 nm - 490 nm) 173 µW/cm² = 1.73 W/m² green ( 490 nm - 575 nm) 137 µW/cm² = 1.37 W/m² yellow ( 575 nm - 585 nm) 15.4 µW/cm² = 0.154 W/m² orange ( 585 nm - 650 nm) 76.9 µW/cm² = 0.769 W/m² red ( 650 nm - 780 nm) 56.6 µW/cm² = 0.566 W/m² IR2 ( 655 nm - 685 nm) 28.4 µW/cm² = 0.284 W/m² IRA ( 700 nm - 1400 nm) 13.9 µW/cm² = 0.139 W/m² IRB ( 1400 nm - 3000 nm) 0 µW/cm² = 0 W/m²
(5b) Actionspectra
Erythema 1.7 UV-Index Pyrimidine dimerization of DNA 21 µW/cm² Photoceratitis 2.74 µW/cm² Photoconjunctivitis 0.0349 µW/cm² DNA Damage 0.116 Vitamin D3 7.9 µW/cm² Photosynthesis 344 µW/cm² Luminosity 1160 lx Human L-Cone 170 µW/cm² Human M-Cone 152 µW/cm² Human S-Cone 141 µW/cm² CIE X 161 µW/cm² CIE Y 160 µW/cm² CIE Z 264 µW/cm² PAR PPFD 22 µmol/m²/s Extinction preD3 57.7 e-3*m²/mol Extinction Tachysterol 204 e-3*m²/mol Exctincition PreD3 26900 m²/mol Extinction Lumisterol 5.82 m²/mol Exctincition Tachysterol 294000 m²/mol Extinction 7DHC 3.9 m²/mol L-Cone 138 µW/cm² M-Cone 186 µW/cm² S-Cone 241 µW/cm² U-Cone 80.3 µW/cm² UVR - ICNIRP 2004 1.16 Rel Biol Eff Melatonin Supression 191 µW/cm² Blue Light Hazard 158 µW/cm² (136 µW/cm² per 1000 lx) CIE 174:2006 PreVit D3 8.74 µW/cm² Lumen Reptil 1430 "pseudo-lx" Vitamin D3 Degradation 10.6 µW/cm² Actinic UV 1.15 µW/cm² (9.89 mW/klm) Exctincition Lumisterol 9420 m²/mol Exctincition 7DHC 5540 m²/mol Exctincition Toxisterols 4870 m²/mol
(5c) Broadbandmeters
Solarmeter 6.2 (UVB, pre 2010) 67.1 µW/cm² Solarmeter 6.5 (UV-Index, pre 2010) 2.27 Leybold UVB 48.2 µW/cm² Leybold UVA 119 µW/cm² Leybold UVC 0.000841 µW/cm² DeltaOhm UVB 115 µW/cm² DeltaOhm UVC 13.9 µW/cm² Vernier UVB 16.1 µW/cm² Vernier UVA 146 µW/cm² Gröbel UVA 160 µW/cm² Gröbel UVB 23.3 µW/cm² Gröbel UVC -0.0155 µW/cm² Luxmeter 1190 lx Solarmeter 6.4 (D3) 7.09 IU/min UVX-31 124 µW/cm² IL UVB 0.0278 µW/cm² IL UVA 133 µW/cm² Solarmeter 6.5 (UVI, post 2010) 1.96 UV-Index Solarmeter 6.2 (UVB, post 2010) 45.5 µW/cm² (Solarmeter Ratio = 23.2) Solarmeter AlGaN 6.5 UVI sensor 28.8 UV Index GenUV 7.1 UV-Index 1.64 UV-Index Solarmeter 10.0 (Global Power) (manuf.) 5.76 W/m² Solarmeter 4.0 (UVA) 1.71 mW/cm² LS122 (manuf.) 0 W/m² ISM400 (first guess) 3.32 W/m² LS122 (assumption) 0.148 W/m² ISM400_new 2.63 W/m² Solarmeter 10.0 (Global Power) (assumption) 4.96 W/m²
(5d) Summary of my favourites
| UVC (0nm -280nm) [µW/cm] | 0 | 0 % |
| non-terrestrial (0nm -290nm) [µW/cm] | 0 | 0 % |
| UVB (EU) (280nm -315nm) [µW/cm] | 34.4 | 4.81 % |
| UVB (US) (280nm -320nm) [µW/cm] | 56.1 | 7.84 % |
| Solar UVB (290nm -315nm) [µW/cm] | 34.4 | 4.81 % |
| UVA (EU) (315nm -380nm) [µW/cm] | 191 | 26.8 % |
| UVA (US) (320nm -380nm) [µW/cm] | 170 | 23.7 % |
| UVA2 (medical definition) (320nm -340nm) [µW/cm] | 92.5 | 12.9 % |
| UVA1 (medical) (340nm -400nm) [µW/cm] | 82.3 | 11.5 % |
| UVA D3 regulating (315nm -335nm) [µW/cm] | 89.9 | 12.6 % |
| vis. UVA (350nm -380nm) [µW/cm] | 39.4 | 5.51 % |
| VIS (380nm -780nm) [µW/cm] | 489 | 68.4 % |
| blue (420nm -490nm) [µW/cm] | 173 | 24.1 % |
| total2 (250nm -880nm) [µW/cm] | 715 | 100 % |
| Erythema [UV-Index] | 1.7 | |
| Luminosity [lx] | 1160 | |
| Blue Light Hazard [µW/cm²] | 158 | 136µW/cm/1000lx |
| Solarmeter 6.5 (UVI, post 2010) [UV-Index] | 1.96 | |
| Solarmeter 6.2 (UVB, post 2010) [µW/cm²] | 45.5 | |
| Actinic UV [µW/cm²] | 1.15 | 5.13 at UVI7.6 |
| Vitamin D3 [µW/cm²] | 7.9 | 35.3 at UVI7.6 |